Northeast Georgia Real Estate Market Update: September 2026

If you’re thinking about buying or selling in Northeast Georgia, September’s numbers offer a useful reminder: the market is still moving, but the pace and pricing differ considerably from one county to the next.
Hall County’s single-family closings were almost unchanged from September last year, while buyers had more homes to choose from and properties took longer to sell. Across the surrounding counties, inventory generally increased, but prices and sales activity followed different paths.
For sellers, that makes pricing and presentation especially important. For buyers, the additional choices create more opportunities to compare properties and negotiate thoughtfully.
Hall County Real Estate: Inventory Rises, Sales Grow and Prices Ease
September 2026 Market Update: More homes to choose from, more closings through the first nine months, and a lower median sales price.
Hall County recorded 186 single-family home sales in September, compared with 187 a year earlier. The median sales price was $432,495, down 2.4%, while the average sales price increased 1.8% to $521,924.
Those two price measures can move in different directions because they reflect the mix of homes sold. A change in the county median does not mean every property’s value changed by that amount.
Several other indicators help explain the market:
Inventory: 920 homes for sale, up 8.5%.
Months of supply: 5.0, compared with 4.8 a year earlier.
Days on market until sale: 63, up from 51.
Pending sales: 138, down 25.4%.
New listings: 280, down 10.3%.
Percent of list price received: 97.5%.
The decline in pending sales deserves attention because it measures homes going under contract, rather than transactions already reaching closing. It suggests a softer September contract pace, although one month alone does not establish what will happen next.
The year-to-date picture is stronger for sales volume. Through September, Hall County had 1,740 single-family closings, up 6.5% from the same period in 2025. Its year-to-date median sales price was $425,000, down 4.5%.
In other words, more homes sold during the first nine months of the year, even as the median price eased.
September at a glance: Hall and surrounding counties
The following figures cover single-family homes. Price changes compare September 2026 with September 2025.
| County | Median sales price | Price change | Closed sales | Days on market | Homes for sale | Months of supply |
|---|---|---|---|---|---|---|
| Hall | $432,495 | −2.4% | 186 | 63 | 920 | 5.0 |
| Banks | $385,000 | −4.9% | 18 | 56 | 100 | 6.2 |
| Barrow | $371,900 | −5.8% | 131 | 72 | 670 | 4.7 |
| Dawson | $460,000 | +5.7% | 41 | 50 | 245 | 6.2 |
| Habersham | $325,700 | −4.2% | 48 | 46 | 275 | 6.0 |
| Jackson | $443,707 | +7.6% | 134 | 77 | 864 | 6.1 |
| Lumpkin | $394,000 | −2.7% | 29 | 66 | 173 | 5.7 |
| Stephens | $252,500 | −17.9% | 31 | 61 | 158 | 5.3 |
| White | $330,000 | +0.7% | 46 | 89 | 292 | 7.0 |
Months of supply describes the relationship between available inventory and the sales pace. It is not a prediction of how long an individual home will take to sell.
What stands out across the region?
Jackson and Dawson counties posted higher September median prices alongside more inventory. Jackson’s median rose 7.6%, while its available inventory increased 30.5%. Dawson’s median increased 5.7%, with inventory up 31.7%. More choices for buyers do not automatically translate into lower median prices every month.
Dawson also illustrates why it helps to look beyond closings. September closed sales increased 5.1%, but pending sales declined 46.9%. Its year-to-date closings remained ahead of last year by 13.8%.
White County had the highest single-family supply among these nine counties, at seven months. Homes sold in September recorded 89 days on market, and sellers received 94.5% of list price. Yet year-to-date closings increased 22.2%. Sales activity has improved even while buyers have substantial selection.
Habersham’s inventory grew sharply. Available homes increased 46.3% to 275, bringing supply to six months. Its September median price declined 4.2%, although the year-to-date median remained 1.5% above last year.
Barrow’s selling timeline lengthened. September days on market increased from 43 to 72, while inventory rose 24.1%. Closings were nearly unchanged, but the median price declined 5.8%.
Lumpkin’s quieter September followed stronger sales earlier in the year. September closings fell 25.6%, but year-to-date closings were still up 13.3%, with a nearly unchanged year-to-date median of $400,000.
Banks and Stephens require some perspective on monthly price changes. Banks recorded just 18 single-family closings in September. Stephens recorded 31, with a median price down 17.9% from a year earlier. However, Stephens’ year-to-date median was up 1.2%. These differences show how the homes sold during a particular month can influence the headline numbers.
Hall County townhomes and condos
Hall County’s attached-home market offers another option for buyers.
September brought 29 townhome and condo closings, unchanged from last year. The median sales price was $324,038, down 6.1%, with 170 homes available and 5.2 months of supply.
Through September, closings increased 23.4% to 311, while the year-to-date median price declined 1.3% to $327,000.
Townhome and condo sales were much smaller in several surrounding counties, so large percentage changes there should be interpreted carefully. Jackson County, for example, recorded only one attached-home closing in September.
What this means if you’re selling
Buyers have more properties to compare in much of Northeast Georgia. Your home’s price, condition, photography and accessibility for showings all help determine whether it makes their short list.
The most useful comparison is with homes competing directly with yours: similar location, price range, condition and features. Countywide statistics provide context, but they cannot establish the right asking price for an individual property.
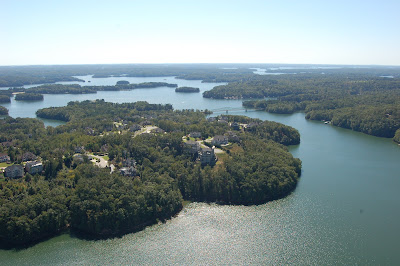
For Lake Lanier homes, that comparison also needs to account for dock access, water depth, views, shoreline and the walk to the lake. These reports do not separate lakefront sales from other residential properties.
What this means if you’re buying
More inventory can give you room to compare homes and discuss price, repairs, closing costs or other terms. The opportunity depends on the property and its competition.
A well-positioned home may still attract strong interest. Understanding recent comparable sales and the available alternatives helps you recognize value when you find it.
Let’s talk about your property and your plans
I’ve been selling North Georgia real estate since 1988, and county averages are only the starting point for a useful conversation. These numbers reflect single family detached inventory only, not attached townhome/condo metrics.
Thinking about selling, buying or making a move around Lake Lanier or Northeast Georgia? Call Kim Waters. Let’s look at the homes you would actually compete with—or consider buying—and build a plan around your goals.
Source: Georgia Association of REALTORS® Local Market Updates for September 2026, using MLS data compiled by ShowingTime Plus, LLC. Reports current as of October 16, 2026. Unless otherwise noted, figures refer to single-family homes; year-to-date figures cover January–September. Reported prices and percent of list price received do not account for seller concessions or down payment assistance. These residential reports do not measure land or commercial market conditions.

Kim Waters
770.540.3788
kim@kimwaters.com

Comments
Post a Comment